

This guide is brought to you by Zen Flowchart, the simplest flowchart maker.
--
The term EPC Diagram refers to the Event-Driven Process Chain, which businesses often use for plan visualizations and organizations. Its functions resemble typical flowcharts and involve certain EPC-specific symbols.
Originally designed as a core element of the ARIS, EPC gained widespread use in other fields. This program remains on-trend even to this day. It is the key to better productivity and success rates across varied lines.
Despite its popularity, many business owners express confusion about its rules and symbols. The following guideline aims to clear things up.
Overview Of EPC Diagram
Definition

EPC diagrams (Event-driven Process Chain Flowcharts) are a graph for descriptions of business process workflows. In 1992, Professor Scheer and his long-term colleagues in Saarland developed EPC. Since then, the diagram has been under widespread industrial usage.
The fundamental modeling approach in this system serves to connect perspectives in the command view. As per a 2006 guidebook, an EPC diagram boasts a set of connectors that enable alternate and parallel execution. Logical operators AND, OR, and XOR enhance its efficacy.
Assertions that EPCs are oriented graphs also hold in other similar guidebooks. There seem to be no limits on the construction of EPCs. Still, complex structures with concurrency have poorly-defined operation semantics.
Numerous research works have strived to develop well-defined concepts for EPC diagrams. One difficulty is that EPCs call for non-local semantics, which means the relationships between elements are tight.
What Is The Use of EPC Diagrams?
Businesses use EPCs to model, analyze, visualize and alter business processes. As part of ARIS, these diagrams only connected with SAP R/3 modeling in its earlier days. However, their usages expand further late on.
One reason for this popularity lies in their brevity and straightforward notations.
Symbols
This section will discuss the Event-driven Process Chain elements.

Event
An EPC diagram should always begin and conclude with an Event by and large. Within a system, Events are passive elements. They specify the conditions for a business process to perform. Other occasions also address the state in which such processes turn out.
"Requirement captured," "Material in stock," and so on are examples of Events. Their graphical symbols often take the shape of a hexagon.
Function
Contrary to Events, Functions are active elements, as they define a transformation from one state to another. A Function simulates the jobs or activities that occur inside the organization.
An appropriate resulting state may be expressed explicitly via logical connections if possible. In some circumstances, users can refine these functions into a new EPC. At that point, the proper term for them would be "Hierarchical Function".
Typical cases of Functions are "capture demands", "verify material in stock", and so on. A typical Function symbol appears as a rounded rectangle.
Process Owner
The process owner is accountable for the main operation. A real-life example would be a booking clerk in charge of booking journeys.
Often, the process owner is an element of a business unit, similar to how a booking clerk works in a booking department. The portrayal of process owners is a square with diagonal lines in the diagram.
Process Path
In a diagram, process routes serve as a navigation aid. They demonstrate one-sided or interdependent relationships between procedures. Common signals for process routes are compound marks, where Function signs lay on top of an Event symbol.
The indicators for progress paths should attach a signal. This trademark suggests that the first progress encompasses the totality of the second.
Organization Unit
Organization units define which enterprise branch is accountable for a certain Function. "Sales Department," "Logistics Department," and so forth are some illustrations. They are denoted as an ellipse connected by a vertical line.
Data, Material, and Resource Planning

Data, material, or supply objects represent real-world items in a diagram. They might contain entities, business objects, or other domain concepts. Examples include "Material" and "Order", which serve as input or output data for Functions. The symbol for such items is a rectangle in the Event-driven Process Chain.
Control Flow
Control flows link Events with Functions, establishing their temporal order and logical interdependence. A dashed arrow represents a control flow.
The Data Movement
The data flow illustrates the relationship between Functions and the input or output information. A Function command would either read, modify, or publish such data.
Assignment of Organizational Units
Organizational unit assignments connect an organizational system with its tasks for execution.
Logical Connector

Logical connections represent the rational linkages between components in a control flow. It is possible to divide and sync the flows between two or more movements.
Logical Relationships
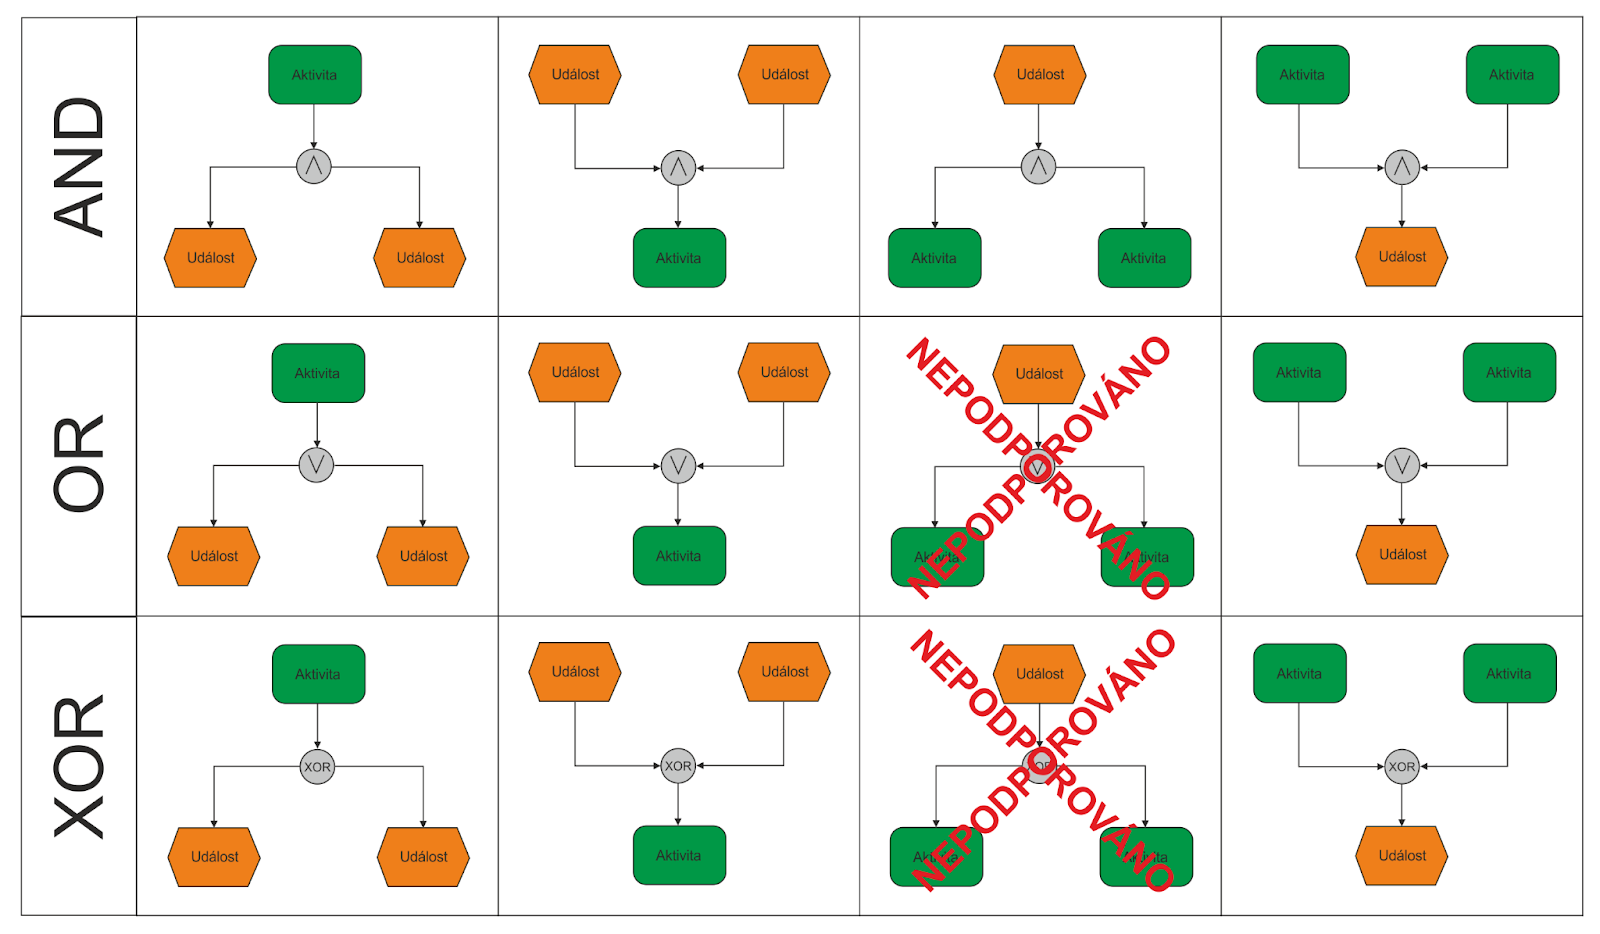
Three types of logical connections are present in an Event-driven Process Chain.
Branch/Merge: Branch and Merge refer to the process of choosing paths among control flows. In terms of symbols, the opening XOR depicts a branch, and a closing XOR operator portrays a merge.
Fork/Joint: Fork and joint imply a simultaneous activation of all pathways in the control flow. Throughout the EPC, a fork is denoted by an open AND, while a closed AND represents the joint.
OR: An OR connection entails the start of one or more control flow pathways. The closing OR connection will forward the control to an element lying immediately next to it.
Steps to Draw EPC Diagrams
It has been established that EPC diagrams enhance visualizations and presentations. However, it might be tough for diagram users to craft effective graphs. A flowchart maker would smoothen the drawing process in such cases.
Specific instructions depend on types of software, but the general guidelines proceed as follows:
Step 1: Tap New from the File menu, then hit Business Diagram.
Step 2: Select EPC from the Business Diagram pop-up menu.
Step 3: An array of symbols, "EPC Diagram Shapes", sits on the side. Drag and drop the chosen ones into the canvas.
Step 4: Bind these symbols using line linkages, curve connectors, or dynamic relations.
Step 5: Select a shape to add words and phrases. Once done, click anywhere outside the text block to finalize this addition. Choose the appropriate function shapes and hit Align in the Home menu.
Step 6: Customization for extra aspects is feasible, which helps improve the visual appeal.
